Getting started
In this tuotrial we will show how to use existing MC runs (msr) files to compute DIS observables. A vanilla setup which includes MC samples extracted from DIS data is available at https://github.com/JeffersonLab/analysis-simul .
import os
conf={}

#--setup posterior sampling
conf['bootstrap']=False
conf['flat par']=False
conf['ftol']=1e-8

#--setup qcd evolution
conf['dglap mode']='truncated'
conf['alphaSmode']='backward'
conf['order'] = 'NLO'
conf['Q20']   = 1.27**2
1. Things to have in your wdir
Unless you are are using the example repo, we will assume that you have folders with msr files and msr-inspected files.
2. The driver.py
The driver.py for a basic the simulation
looks like this
#!/usr/bin/env python
import os,sys

import kmeanconf as kc
from analysis.corelib import core
from analysis.corelib import inspect
from analysis.corelib import predict
from analysis.corelib import classifier
from analysis.corelib import optpriors
from analysis.corelib import jar
from analysis.corelib import mlsamples
from analysis.corelib import summary
from analysis.qpdlib  import tolhapdf
from analysis.qpdlib  import benchmark
from analysis.simlib  import sim

wdir=sys.argv[1]

#--initial processeing
#inspect.get_msr_inspected(wdir)
#predict.get_predictions(wdir)
#classifier.gen_labels(wdir,kc)
#jar.gen_jar_file(wdir,kc)
#summary.print_summary(wdir,kc)
##optpriors.gen_priors(wdir,kc,1000)


#--DIS simulation (level 0)

#--gen kinematics:
#--option==0 for lhapdf grid. To be use to create stfuncs grids
#--option==1 physical grid using root_s
X,Q2=sim.get_xQ2_grid(option=0,rs=None,nx=10,nQ2=10)

stf =['F2','FL','F3']
idxs=[90001,90002,90003]
for i in range(len(stf)):
    sim.gen_idis_xlsx(wdir,idxs[i],'p',stf[i],X,Q2)

conf=sim.gen_conf_idis(wdir,idxs)
predict.get_predictions(wdir,mod_conf=conf)
sim.update_idis_tabs(wdir,idxs)
sim.gen_lhapdf_dat_file(wdir,idxs,setlabel=0,dirname='JAM4EIC')

info={}
info['<description>'] = 'F2,F2 simulation for EIC'
info['<index>']       = '0'
info['<authors>']     = 'JAM Collaboration'
info['<reference>']   = 'jam19'
info['<particle>']    = 'p'
sim.gen_lhapdf_info_file(wdir,idxs,info,dirname='JAM4EIC')

sim.benchmark(wdir,idxs,'JAM4EIC')
As usual, it is expected that you run the driver.py as
./driver.py <path-to-folder-containing msr folder >
Basic usage
sim.get_xQ2_grid: this function generates the
X-Q2grid. option=0 for lhapdf like grid and option=1 for custum grid.sim.gen_idis_xlsx: this generates the corresponding xlsx file inside
<wdir>/sim/idx.xlsxsim.gen_conf_idis: this adjust the
confdictionary to only use the xlsx file for the simulationget_predictions: this will launch
resmanand compute the observables for all the replicas inmsr-inspectedupdate_idis_tabs: this will overwrite the previously generated xlsx files to add numerical values for the observable (recall only one observable per table is allowed)
LHAPDF
If the simulated data is now needed to be converted into LHAPDF format we proceed to use the following routines
gen_lhapdf_dat_file: this will generate the tables in LHAPDF format
sim.gen_lhapdf_info_file: this will generate the info file which is required by the LHAPDF program to load the tables
sim.benchmark: as a sanity check we need to load the tables in lhapdf and compare for each
x-Q2the true values and the interpolated values. The benchmark will create temporary symlinks at your lhapdf/share folder and upon completion it remove the symlinks. If you run into an error it means you do not have permissions to write on lhapdf installation folder. i.e. you need to have your own lhapdf installation. The rutine will generate benchmark plots at<wdir>/gallery/benchmark-<name>-idx.pdf. You should see plot like this:
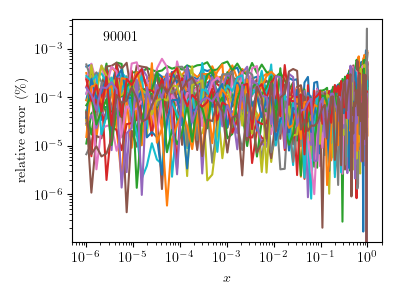
Make sure that the relative errors for your observables are small enough (~1e-3) for further applications.
Simulate statistical uncertainties
The relevant code lines to be added in the driver.py
are the following
#--DIS simulation (level 1)
#--physical params
rs= 140.7
lum='10:fb-1'
#--lhapdf set and stf idx
iset,iF2,iFL,iF3=0,90001,90002,90003
#--names for the xlsx table
dirname='JAM4EIC'
idx=90100
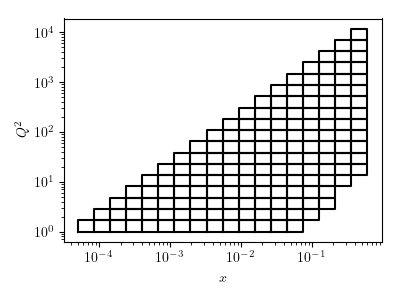
data=sim.get_xQ2_bins(rs=rs,nx=20,nQ2=20,sign=1,W2cut=10)
sim.plot_kinematics(wdir,data)
sim.gen_sim_idis_xlsx(wdir,dirname,iset,iF2,iFL,iF3,data,idx,lum)
iset: is the index associated with the lhapdf stfuncs tables generated before
iF2,iFL,iF3: are the flavor indices as specified in the previous steps
sim.get_xQ2_bins: this generates a dictionary of bins in x and Q2 in log space.
gen_sim_idis_xlsx: this rouine will produce a an xlsx table with simulated statistical uncertainties.
sim.plot_kinematics: a simple routine to plot the generated kinematics